
There's no denying it: an unhappy customer's Tweet is the "Can I speak to your manager" of the digital age. And while this might fill a poor social media managers heart with dread, using X, formerly known as Twitter, for customer service should be seen as an opportunity rather than a burden.
After all, this is not only your chance to speak directly to that customer and provide solutions (with the added benefit of being able to control and verify your message before answering), it also means that other customers and potential customers can see how you interact with your consumer base. In that sense, companies using X/Twitter for customer service can also be considered PR.
We've complied some of the best examples of customer service on X/Twitter to illustrate how you can use this platform to help solve customer issues and build respect as a brand.
Contents
Tactics For Finding and Resolving Customer Complaints on Twitter
Things to Keep in Mind for Effective Customer Service on Twitter
4 Excellent Examples of Companies Using Twitter for Customer Service
Early Trendsetters in Twitter Customer Service
PR & Marketing Takeaways
Tactics For Finding and Resolving Customer Complaints on Twitter
There are a few different ways you can choose to find and respond to customer complaints on X, formerly known as Twitter.
Many businesses create a separate profile specifically designed for offering support and fielding complaints. This is useful in that it means you can separate mentions of your primary account from those that you know are likely asking for assistance, which can help for reporting as well as making sure you don't miss these mentions.
Whether you decide to establish a separate Twitter account for customer support or not, it is highly recommended to use a social monitoring tool to track when your brand is being mentioned. Remember that while most X/Twitter users asking for the manager, ahem, going to Twitter for complaints, will be savvy enough to tag you, some may not.
So setting up a more sophisticated monitoring system that can flag specific keywords and queries will help you stay on top of things and ensure timely responses. Meltwater social listening pulls all your mentions into a shared inbox as well, which means you don't have to go natively through Twitter to respond to every @.
In addition to tracking your brand name, you could also track competitor handles and industry buzzwords. This helps avoid potential crises, but also helps brands find unique opportunities to take advantage of other companies customer service inquires.
Things to Keep in Mind for Effective Customer Service on Twitter
Every brand will have their own approach to using X/Twitter to answer customer complaints and questions, but here are a few tips to keep in mind as you get started:
Timeliness
Be personable
An @ is still an @, regardless of follower count
Watch for commonly asked questions
Customer service isn't just about putting out fires
Timeliness
First and foremost, being timely with your response is key to starting off on the right foot. Even if you don't have all the answers right away, it's important to let the customer know (and those who may be lurking on the conversation) that you care about their issue and are invested in helping them resolve it.
Be personable
There is a fine line between being personable and appearing flippant when it comes to customer service in general, but especially through written text where certain inflections and facial expressions aren't available, so you do have to be careful with how you phrase your customer responses on X, formerly known as Twitter.
Assess the customers' tone and state of mind and the severity of their issue to see if injecting any humor or levity into your response will help ease tension, or make it worse. In every case, you should offer a solution or an actionable next step so they feel progress being made.
Tip: While being personable is effective, don't think that every single response needs to be original. Oftentimes directing customers to send you a DM with additional info is the best next step, and there's only so many ways to phrase that.
An @ is still an @, regardless of follower count
While you may want to prioritize customer complaints based on reach, to stem the flow of a potential crisis, this does not mean you should let an @ from someone with no following fall by the wayside.
Watch for commonly asked questions
If you start to see a trend in the kinds of issues your customers are running into, it's a good idea to compile these into an "FAQ" blog post or landing page that you can address users to.
You should also have a doc of common responses you've used, tracking which ones have been most effective so you can speed up your response time to these questions.
Customer service isn't just about putting out fires
When you conduct customer service online in a public forum like X/Twitter, it can sometimes seem like all your dealing with is trolls or people who feel extra-empowered being behind their computer screens.
This is all the more reason that you shouldn't ignore positive comments! Responding to these unprompted compliments, recommendations, and other forms of UGC creates positive reinforcement, especially if you have a strongly developed brand personality.
You don't even have to offer a gift each time, like shoe company Rothy's, who went the extra mile for this happy customer:
Shamelessly using my @rothys addiction in a How Many number sense routine…thank you for indulging me, Mr. McDaniel! @Trianglemancsd @APSMath pic.twitter.com/l6xXdc6kbY
— Christine Chapuis (@ChapuisC123) October 4, 2022
Just acknowledging that you or one of your employees made someone's day can be enough:
I'm so glad to learn my Cohearts were able to make your trip a memorable one, Hannah. I can't say it enough, we do have the best Crew in the biz! Do you mind DMing me your confirmation number? I'd be more than happy to share the kudos with our Crew! -Amanda
— Southwest Airlines (@SouthwestAir) October 5, 2022
When you establish a pattern of replying, it encourages others to do the same and that's a self-fulfilling prophecy of establishing your online presence and brand awareness.
4 Excellent Examples of Companies Using Twitter for Customer Service
These companies take their customers' outreach on X/Twitter seriously (sometimes with a sense of humor) and work quickly to resolve the issues.
Nike
Nike has frequently been featured on lists of great examples of brands on X, formerly known as Twitter. Part of this comes from them having a solid understanding of their customer and their customer's needs, desires, and product use cases, whether it's living up to a pristine new shoe:
We're here to help. Where did you purchase those shoes? If you got them directly from us, let's have you pass us your Nike member email and order number in DM and we'll take a look at your options moving forward. https://t.co/klmMF0Q8Tn
— Nike (@Nike) October 3, 2022
Or helping a mother of a quickly growing boy find the right size!
@Nike-my kid needs size 17 running shoes!! Help, I have not been able to find any Nikes for running in his size for almost 6 months!
— Jenn Whitters (@JWhitt32569) September 2, 2022
Nike does an exemplary job of addressing customer questions and complaints in a quick, professional, but non-robotic manner. While they do respond to customer inquiries from their primary corporate account they also have a specific support Twitter profile set up: @NikeService, which they also use for customer-specific announcements such as site issues and product availability.
Southwest Airlines
Twitter is one of the best platforms for Airlines to keep their customers in the loop on delays, gate changes, and other common headaches that arise in air travel. Even if airline customer service is not industry-consistent, consumers are now primed to request and importantly, receive, help before, during, and after their travels via social platforms.
Southwest Airlines is one of the best. While the airline has traditionally been known for good customer service, being on Twitter has only added to this brand perception and brand credibility.
They freely use the enhanced customer service features, such as the Send a Private Message link, making it easier to immediately help individuals with their travel arrangements:
Thanks for reaching out, and I am so sorry for any frustrations with your recent experience with us. Please feel free to follow up in a DM if you would like to speak further. -Allison https://t.co/mQmfkYedD3
— Southwest Airlines (@SouthwestAir) October 5, 2022
They're also top tier when it comes to interacting with their customers and going above and beyond to provide excellent service, like in this case:
@MeekzMilly BK There might be a free drink in your future! Thanks for spending Turkey Day with us!
— Southwest Airlines (@SouthwestAir) November 12, 2012
On X/Twitter at least, Southwest is showing other airlines—let alone other brands—how to endear themselves to followers. And with 2.19 million followers, they can broadcast flash sales, announce corporate social responsibility initiatives, and other important information, all while still helping customers with individual flights.
Dominos Pizza
Dominos does an excellent job interacting with their customer base, always sticking to their conversational, caring, sometimes humorous tone.
Yikes! That sounds disappointing and we’d like to help. Can you please DM us? *Jason https://t.co/Cf8BiToVpb
— Domino's Pizza (@dominos) October 4, 2022
They do take advantage of using the same canned responses, likely assisted by a bot, however, the copy is still designed to offer immediate action toward a solution, via their DM system.
Yikes! That sounds disappointing and we’d like to help. Can you please DM us? *Jason https://t.co/Cf8BiToVpb
— Domino's Pizza (@dominos) October 7, 2022
Dominos has also used Meltwater to improve their social media strategy! Check out their customer story for more.
Charmin
Charmin has a strong brand to begin with, leaning into the basic human need for toilet paper with levity, frankness, a great sense of humor, and of course their recognizable mascots. On Twitter, Charmin uses this reputation in their customer service, maintaining a cutesy tone, and utilizing several emojis as part of their online brand personality.
How em-BEAR-assing, Fae. 🐻 🤦 This isn't our usual quality roll out, and we apologize that you received rolls in this condition. We'd be more than happy to see how we may be able to help, and make this right. Could you please hold on to these, and DM us?
— Charmin (@Charmin) September 19, 2022
They even take a somewhat daring approach using the peach emoji like in responses like this and others:
When you're using Charmin Flushable Wipes, all you should have left is a smile 😀and a shiny, clean hiney 🍑. Each pack goes through many quality checks to ensure they're perfect. We hope you'll roll us a DM with more details, sharing info from your last pack, talk soon! 💙
— Charmin (@Charmin) October 3, 2022
Charmin takes customer service seriously, making sure their customers feel seen, heard, and taken care of. As a brand with a niche, needs-based product, they've carved out a unique space on X/Twitter for communicating with their audience.
Early Trendsetters in Twitter Customer Service for Brands
These early adopters of customer service on X/Twitter were trendsetters, helping create the broader culture of brands responding to customers on the platform:
Maytag
RIP: OUR BRAND NEW MAYTAG WASHING MACHINE.
— Heather B. Hamilton (@dooce) August 26, 2009
Back in 2009, well-known blogging influencer, Heather Armstrong, was pulling out her hair trying to get replacement parts for a $1,300 Maytag washer and asked a telephone service rep if it would help if she mentioned her woes on Twitter? Despite an assurance that it wouldn’t, she decided to broadcast her frustration to her 1 million followers anyways.
That brand new washing machine from MAYTAG? That someone has been out to fix three times? STILL BROKEN. DO NOT BUY MAYTAG.
— Heather B. Hamilton (@dooce) August 26, 2009
Soon a Whirlpool VP (Maytag’s parent company) was on the phone, ordering her a new repairman and the next day, her washer was back in working order - anything to avoid tarnishing brand perception! Maytag (and Whirlpool) learned a quick lesson that day; influencers have an engaged audience.
A new approach to getting social media customer service began to quickly take shape after this. It still began traditionally: emailing or calling the company to try to get a resolution. If you didn't received customer service within 24 hours, call them out on Yelp, Twitter, or via Facebook.
As the lines between communication platforms began blurring, it seemed more efficient to go straight to social media. Maybe it was because early adopters/influencers were getting better service in less time, while regular consumers felt left out. (Everyone wants customer service right away.) What had seemed like a luxury of the few, started looking attainable to more and more consumers who saw the power of complaining on public channels.
Tip: Take a look at these social media customer service examples to get inspired.
Comcast
The first time Comcast was mentioned on Twitter, it was in the form of a complaint about waiting in line.
To address complaints that were organically appearing on the platform, their marketing/ PR team set up @ComcastCares in March 2008. Making them an early corporate adopter with a dedicated service channel. (Contrast that with the launch date of November 2009 for the brand account, @Comcast.)
Comcast pioneered acknowledging a complaint and asking if it can be moved to 1:1 interactions via direct messages. This practice was enabled by X/Twitter, which added direct messaging and separating out public @ replies. Comcast illustrates how customer service is often built into an identity of a brand.
I'll be happy to check on the status of your services. Please send a DM with your full name, name on the account (if different), and account number so I can look into your concerns. Thanks! -KW
— Xfinity Support (@XfinitySupport) January 3, 2018
Bay Area Rapid Transit (BART)

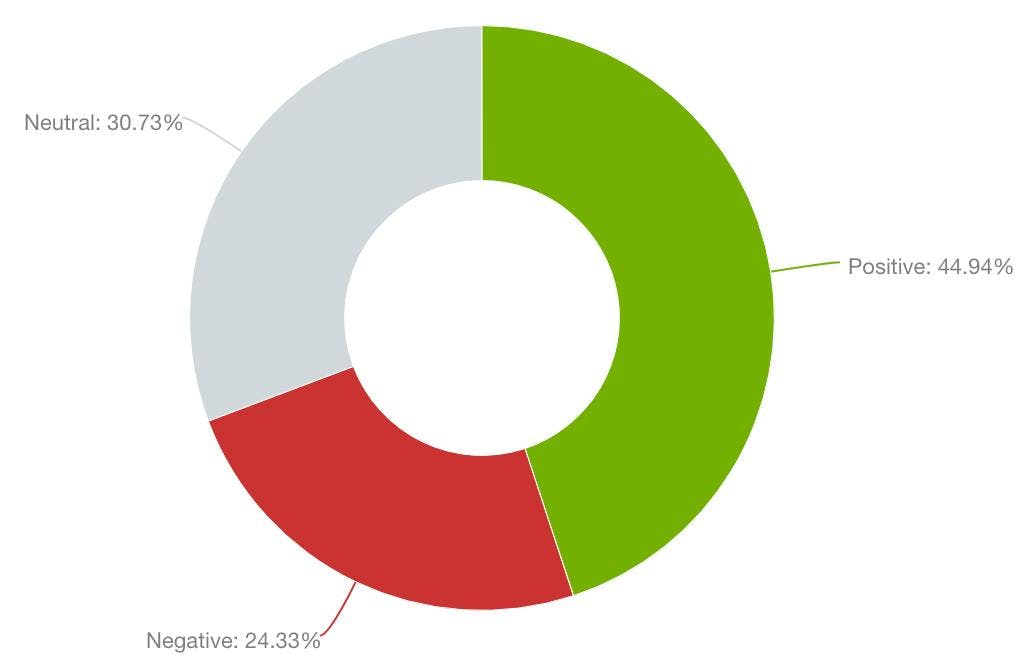
@SFBART social media (Facebook, X/Twitter, and forums) sentiment according to Meltwater media intelligence platform, Jan. 1-Dec. 31, 2016.
Creating a groundswell of positive kudos on social media can feel impossible for marketing and PR pros in today’s climate. It might feel like all you can do is try to keep the crises at bay.
But, the Bay Area Rapid Transit (BART) system found unexpected acceptance by doing away with auto-responses on X/Twitter, and instead opted for a frank conversational tone. It happened on March 16, 2016, during the evening commute, in response to a complaint about massive delays. An electrical issue took out a portion of track and required the system to borrow buses.
In the moment, the cause behind the delays had not been shared. Christopher Chappel (@shakatron, now private) may have thought he was yelling into the void with this tweet:

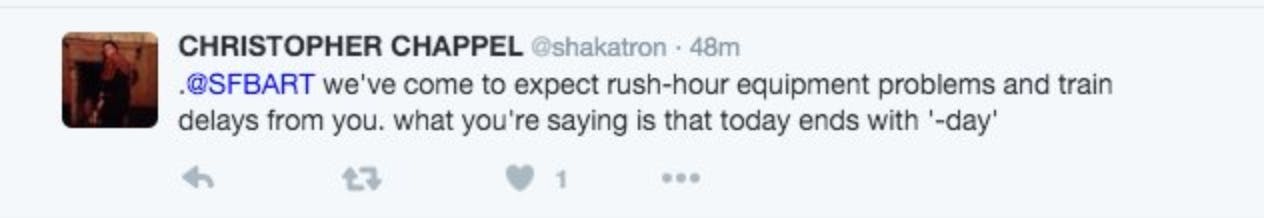
But instead, he received a very thoughtful, very human response. Riders and social media reacted with excitement. Suddenly it became a BART system AMA (Ask Me Anything) as questions, thoughtful answers, and opinions were lobbied back and forth.
@shakatron BART was built to transport far fewer people, and much of our system has reached the end of its useful life. This is our reality.
— BART (@SFBART) March 17, 2016
On that night, BART social media history was being made. Prior to this evening, the transportation system’s Twitter account was automated and didn’t directly interact with customers, let alone discuss the challenges of the system’s infrastructure. Later, articles proposed that the exchange(s) were the result of a social media manager "going rogue”.
@SFBART and tbh part of my comment was admiring. Rare for orgs to keep it real. (also am a loyal rider)
— Emily Wood (@kettering) March 17, 2016
@Thecommich Platitudes don't work. Government must communicate clearly about its shortcomings so democracy can work toward fixing them.
— BART (@SFBART) March 17, 2016
Turns out this new frank tone signaled a change in how the comms team would approach their Twitter interactions with the public. And while the thumbs behind @SFBART that evening decided to take his commute elsewhere, the humanity behind the account is still in place. The team, managed by Alicia Trost, still helps individual users, broadcasts community wins, interacts with other transport agencies, and even apologizes for problems on the system.
PR & Marketing Takeaways
There is no way to avoid dealing with customer service issues or complaints on X, formerly known as Twitter. To protect your brand, it’s essential to keep up on the platform to make sure you're utilizing all the features they offer to streamline processes and ensure customer queries don't get ignored.
If you’re new to dealing with customer service on Twitter, learn from the examples above and make sure you have a system in place to see all incoming mentions, such as using a social listening platform like Meltwater. Interested in seeing it in action? Fill out the form below to schedule a 15-minute demo!